Behaviour
The Story A Chart Tells Depends On Where It Starts
The same investment produces opposite impressions depending on the first date plotted, because a chart's starting point silently defines what counts as normal.

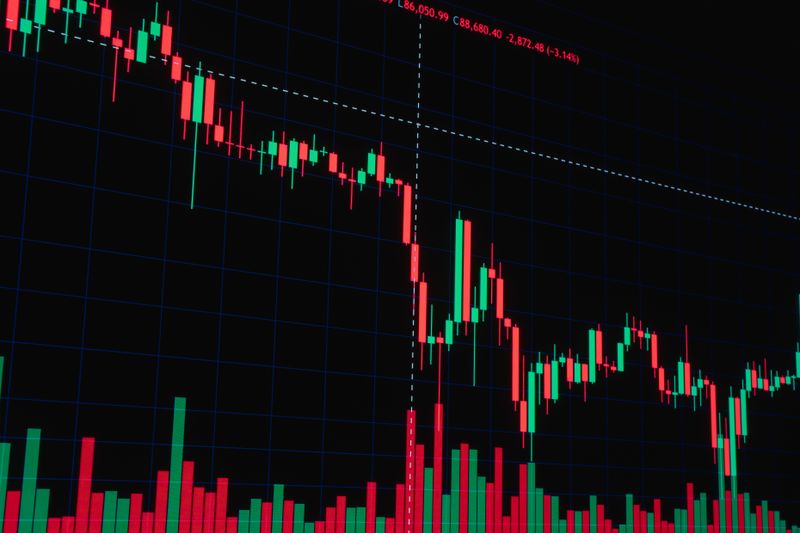
A chart looks like a neutral record, but a chart begins somewhere, and the choice of that somewhere shapes the conclusion. The data can be entirely accurate and the impression still misleading.
The first point sets the baseline for everything after it
Most performance charts are drawn as growth from the first date shown. That date becomes the zero line, and every later value is described as a distance from it.
Choose a start that happened to be a low point and the line rises steeply. Choose a start at a high point and the same holding appears to have gone nowhere for years.
Neither line is falsified. They are two accurate answers to two different questions, and the question was set by an editorial decision about where to begin.
Round time windows are conventions, not analysis
Fund pages and brokerage screens default to windows like one year, five years or ten years. These are habits of presentation rather than periods with any economic meaning.
A ten-year window is especially prone to drift, because what it includes changes each month. A severe decline eventually falls off the left edge, and the record improves without anything happening.
The same mechanism runs in reverse. A window that newly captures a downturn makes a steady strategy look suddenly fragile, though the intervening years were unchanged.
Scale choices change the shape of the same numbers
A chart drawn on a linear scale gives later movements more visual weight, because the same proportional change covers more vertical space once the value is larger.
A logarithmic scale plots equal proportional moves as equal distances, which makes early and late periods comparable. The two charts of one series can look like different investments.
Neither scale is dishonest, but readers rarely check which one they are looking at. The visual impression arrives before the axis label is consciously read.
Comparison lines carry the same hidden choice
Adding a benchmark to a chart appears to settle the question of whether something kept pace. That comparison inherits the same start-date sensitivity as the original line.
Two lines beginning at a common point diverge and reconverge over time, and the gap between them at any moment depends on where the common point was placed.
Comparisons also depend on whether income is included. A price line and a total-return line for the same holding drift apart steadily, and the difference is not always labeled.
Reading a chart with the choice in view
The practical response is to look at the axes before the line. The start date, the scale and the treatment of income determine most of what the picture is capable of saying.
Shifting the start date by a year or two, where the tool allows it, is a quick test. A shape that survives several starting points is describing the investment rather than the window.
Charts remain useful for seeing volatility, drawdowns and long stretches of flatness. They are weaker at answering how good something has been, which depends on a decision the chart does not display.
Questions readers ask
Does the witness need to understand investing?
No. Their job is to remember what you said and ask about it. Someone with strong opinions about holdings is usually a worse choice than someone with none.
What if my plan genuinely needs changing?
Then change it through the procedure you wrote down, which normally means a delay and a written reason. The point is to filter impulses, not to freeze the plan.